|
For our quarterly project this quarter, we all made infographics. I did mine on the steps to making a movie. I chose this topic because I LOVE movies, and I was wondering the steps to making one. To start, I'll say what was easy about making this infographic. The easy thing about making this infographic was placing my facts. Since my topic used steps, I knew I had to make the facts flow easily so the reader could read them easily. Some thing that was hard was not making my infographic look cluttered. since I had so many steps, it was hard to make it not look cluttered. I would also like to talk about an infographic that I thought was really nice. The infographic I am going to talk about was made by Rakshak. His was about the most visited national parks. i liked how he used a map to represent his data. Also, I liked that if you clicked on an icon, you would be taken to google maps to show a national Park. His infographic had good information, and not to little and to much. Good job Rakshak!! 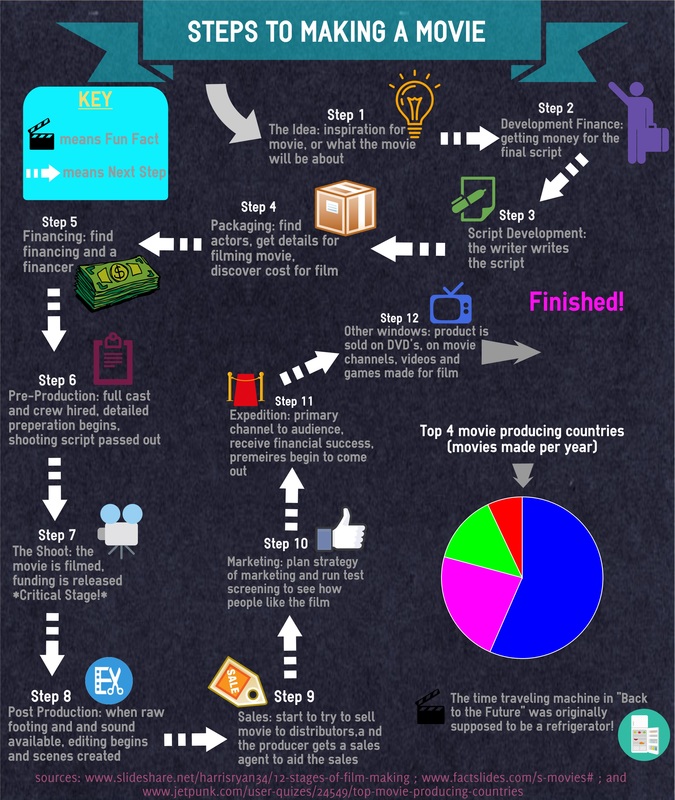 My infographic
0 Comments
|
AuthorI am in middle school and here is a blog about me! Archives
October 2016
CategoriesPhoto courtesy of pics4learning.com |
 RSS Feed
